1.13.2025
Looking Back: 2024 Money Pie
1.08.2024
Looking Back: 2023 Money Pie
Who is ready for a slice of money pie? As you may know, I always do a debrief with myself at the end of each year to see where all my money has gone! I also do a quarterly net worth statement just to get a read on where things are, but I will not be posting that here! :)
In 2023, I am happy to say that I decreased my overall spending from 2022 by about 12% and came in below my yearly (8 year) average by about 9%. The main drivers of this decrease were the travel and home categories, which I will talk more about below.
Here are the categories in the order of largest percentage to smallest.
Home: 63.2%. Interestingly, last year my home category was 63.7% of my overall spending and in 2021 it was 64.1%, so I guess no matter how you slice it, the home category continues to be almost two thirds of my spending! This category includes mortgage, utilities, taxes and insurance, as well as other misc. items, such as home improvement, maintenance and furnishings. 80% of this number is mortgage and property tax. You may remember that I mentioned last year about how I was paying a little extra into my mortgage? This year, given the good rates on cash, I stopped doing that and put the money into high yield savings instead. Due to this, I decreased the actual dollar spending amount in this category by about 13% from last year.
Transportation: 12.2%. This normally includes Lyft/Uber, public transportation, car insurance, maintenance, registration, gas, tolls & parking, but this year I added bike maintenance and parking fees to the category as well. Despite commuting by bike from July to December, I still had public transportation costs, but the main culprit in this category was body work after my car got broken into. I also got four new tires for the Red Rocket and did a full body tune up on Bertha.
Travel: 6.6%. This category includes airfare, car rental, lodging and any groceries, dining out or transportation incurred while traveling. Although I did not travel internationally and much of my travel consisted of tent camping and eating my own meals, some of the other costs incurred during travel were quite expensive this year. I went to Alaska, and the rental car alone was about $1,500!! It was an SUV though and we actually slept in it several times, so saved on hotels, thank goodness. However, even with this, I spent about 50% less on this category than in 2022.
Misc.: 4.4%. This category includes gifts, haircuts, legal fees, fees for credit cards, tax prep software and education expenses. I had to pay for my yearly CFA dues, legal fees to set up a trust and annual credit card fees, but other than that, the bulk of this category was for gifts! (PS no haircuts in 2023 😊)
Groceries: 3.7%. This category went down by 38% from last year, mostly due to the fact that part of my purging process was to stop buying new stuff until I had used up older stuff! I would say that I did a pretty good job and have had fun being creative with cupboard items, but I still bought the regulars like butter, eggs, fresh veggies and cheese. My other saving grace for this category was less trips to Costco and/or only allowing myself to buy what I went in there for! I do have a tendency to grab yummy looking things oh a whim, but this year I put a stop to that! Funny though, out of my six visits to Costco, I bought tortilla chips on five of them. Some habits you just can't break.
Dining Out: 3.5%. This category includes eating out, coffee and booze. This one is a little misleading this year, as I decided that in an effort to spend time with people and have experiences rather than buying more things, I would enjoy meals with them! Given this, I bought meals for friends several times. I could technically call this "gifts," but for now I am going to leave it as dining out. However, it does inflate this category a bit, and I had a 200% increase over last year.
Entertainment: 3.1%. This category includes music, theater, sporting events, cycling and running & camping expenses. In 2023, I went to two shows (Les Mis and Book of Mormon), a couple of sporting events, but my biggest categories for this are still running (32%), hiking (20%) and cycling (19%). My biggest purchases were race fees (three races), a new GPS watch and a new rain jacket.
Health: 2.6%. This category includes health insurance, out of pocket costs, massages, medicines and vitamins etc. This year most of my visits were covered as preventative, so the bulk of this cost is the insurance itself.
Shopping: 0.8%. This category includes toiletries, clothing, misc. home items & appliances, electronics and books. Basically this year I bought three things in this category: a new camera, a 3-pack of underwear that I hated and feminine products. Trying to purge more has really made me think about things more before buying. Also some of the camping etc. items I did buy are included under the entertainment category.
I do also put some money aside for investments and saving each year, but since this money is not yet "spent" I do not count it in this analysis. I also do not include income taxes, but if I did, they would probably be my highest category! However, since I don't have much control over them, I am going to leave them out for now.
Do you do a yearly review of your finances? Do you have a budget? What is your biggest spending category?
1.09.2023
Looking Back: 2022 Money Pie
Well jeez, it is that time of year again! Who wants a slice of money pie? As you know, I always do a debrief with myself at the end of each year (and a check in each quarter although I do not bore you with those details) to see where all my money has gone! You can find past years here.
In 2022, overall I spent about $1,000 more than my average per year. I will detail all of the categories below, but the main culprit this year aside from the obvious elephant (Home) was a combination of Dining Out, Entertainment and Travel. I do keep these separate, but I also like to see what they look like combined, as I consider these three categories discretionary versus necessary. I will discuss more about them in a few.
Here are the categories in the order of largest percentage to smallest.
Home: 63.7%. Not surprisingly, this category continues to lead the pack and this year's 63.7% was pretty much the same as last year's 64.1%. This category includes mortgage, utilities, taxes and insurance, as well as other misc. items, such as appliances, stuff from the hardware store, home improvement and furnishings. The bulk (73%) of this category consists of mortgage payments, partly because it is large, but I also contribute a little bit extra to my principal each month.
I did do a few things around the house like fixing my furnace ($150) but nothing big (like last year's > $1,000 tree trimming). I think with this category, no matter what you do to cut costs, there is always something. This year, due to rising costs, my PG&E (electric and gas) bill was basically double last year's bill much of the time.
Travel: 11.7%. This category includes airfare, car rental, lodging and any groceries, dining out or transportation incurred while traveling. Although most of my travel consisted of tent camping and eating my own meals, some of the other costs incurred during travel were quite expensive this year. I spent about $500 more on my international flight than I did in 2019 so it makes sense that airfare was about 36% of the travel expense (next highest was lodging at 25%)!
Transportation: 7.2%. This includes Lyft/Uber, public transportation, car insurance, maintenance, registration, gas, tolls & parking. Although gas prices were through the roof this year, I actually spent about the same as I usually do in this category. I definitely spent less on public transportation because I had some credit left over from 2020 on my transit card, and I did not have to do any major car maintenance.
Groceries: 5.3%. I guess we all have to eat and I definitely did not skimp in this category (however, my dining out category was basically nonexistent). My weakness is Costco; I cannot get out of there without spending at least $100 (and sometimes a lot more). However, their egg prices are still the best ones in town right now (about $12.00 for five dozen). But I never just buy eggs!
Entertainment: 3.8%. This category usually includes music, theater, and running & camping expenses. This time I added cycling to the mix and I bought both a stationary bike and a mountain bike, so the bulk of the number is split between running (39%) and cycling (38%). Most of my running number is race fees (three races) and shoes (five pairs - when they are on sale, I stock up).
Health: 3.5%. This category includes health insurance, out of pocket costs, massages, medicines and vitamins etc. I don't really pay many or any out of pocket fees that don't get reimbursed, but the premium each month is not super low. However, if I had to pay for my own insurance rather than group insurance, it would be about two to three times higher, so I am happy!
Misc.: 2.4%. This category includes gifts, haircuts, fees for credit cards, tax prep software and education expenses. I only got one cheap haircut and did not pay for any education this year, so most of this was gifts!
Shopping: 1.3%. This category includes toiletries, clothing, misc. home items & appliances, pet stuff, electronics and books. The majority of this went to the cat (flea treatment and litter ain't cheap!) and the next biggest expense was the bidet!
Dining Out: 1.0%. This category includes eating out, coffee and booze. As you can see, it was my smallest category, which makes sense as I do not really eat out much. The bulk of it was really two dinners where I treated, but otherwise, this category was tiny.
However, don't be completely fooled, as I do categorize any dining out that is done on a vacation as "travel." This is why I like to look at the combined categories of Dining Out, Travel and Entertainment to kind of gauge where I am with my fun spending items. If you look at them all together, they would constitute 16% of my overall spending.
I also have two categories that I do not put on here since they are not actual money spent, but I do put some money aside for investments each year and some aside for savings. I think that it is very important to do both, even if the amount is minimal, and especially if you can do it before taxes. You can find more info in this post about how I feel about setting money aside.
Do you do a yearly review of your finances? Do you have a budget? What is your biggest spending category?
1.04.2022
Looking Back: 2021 Money Pie
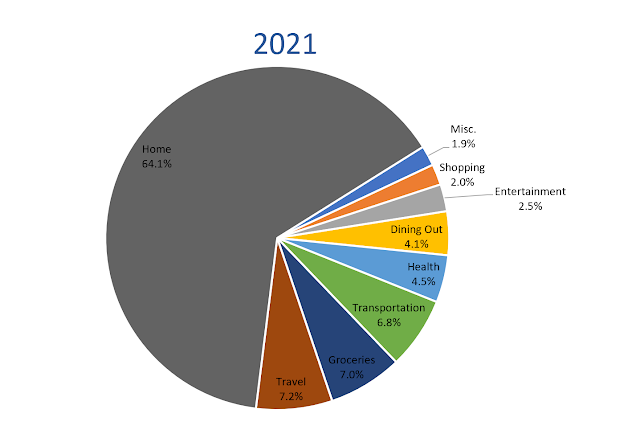
It's money pie time again! This year I spent 10% more than I did last year, mostly due to home expenses, travel and dining out as I will detail more below. Once again this year, I spent the time to itemize my Amazon, Costco and Target trips so that the categories were more accurate (at the beginning I used to just call the whole expense "groceries" or "shopping").
Health: This category includes health insurance, out of pocket costs, massages, medicines and vitamins etc. Health insurance costs went up last year (again) but I spent less in out of pocket costs. At the end of 2020, I finally canceled my gym membership, which saved me about $300 in 2021.
Entertainment: This category includes music, theater, and running & camping expenses. This year I did not spend much on this as I did not go to many events and I had a lot of camping stuff left over from last year that I could use.
Shopping: This category includes toiletries, clothing, misc. home items & appliances, pet stuff, electronics and books. The main cost in this category was office supplies, more specifically a new printer. I spent $0 on clothing.
Misc.: This category includes gifts, haircuts, fees for credit cards, taxes and education expenses. Mostly, this category was gifts, as I spent nothing on haircuts this year (I used YouTube and cut my own hair once and had a friend do it another time) and was reimbursed for my education expenses.
Well, there you have it. 2021 in a nutshell.
What did you spend the most on in 2021?
1.19.2021
Looking Back: 2020 Money Pie
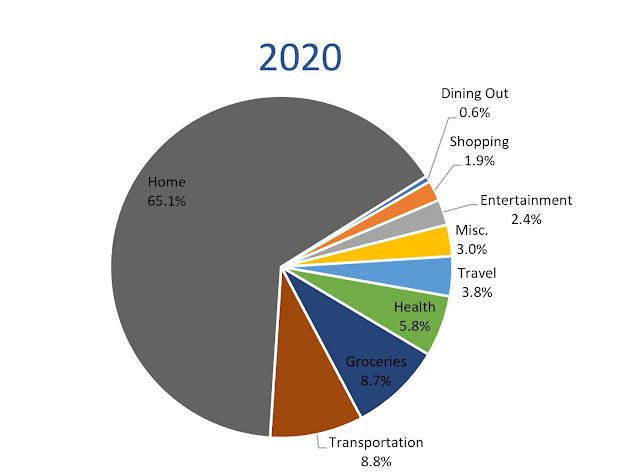
Unfortunately, in 2019 the system that I use for compiling my data had a glitch and I decided not to recreate everything, so I never got 2019 data all put together. This year, I was interested to see how my spending stacked up to prior years, as I did not spend as much money on travel, which is generally my second biggest category. I also wanted to break out some of my shopping a little more fully, and so I spent some time looking through my Amazon, Costco and Walmart receipts since a lot of those are multiple categories, whereas in years past I just called Costco "groceries" and Amazon "shopping."
So without further ado, here is the pie!
Overall, in 2020 I spent 94% of my average over the years of 2016-2018, or 6% less than normal. The categories that decreased the most in dollar terms were Travel and Dining Out and the categories that increased the most were Groceries and Health.
Home: (Increase 2% YoY) This category includes mortgage, utilities, garbage, taxes, insurance and garden. As you can see, this is my largest category by far. However, I spent a little more than I normally do in this category, and I chalk that up to the fact that I decided to start paying a little extra toward my principal midway through the year. Otherwise this category dollar-wise has been very consistent through the years and is always my largest.
Groceries: (Increase 62% YoY) Woof! I spent a lot more on groceries than I normally do, which is probably due to the following: (1) I bought a lot of non-perishables online and I probably went a little overboard. (2) I stocked up at Costco a few times. (3) I decided to experiment with making my own dehydrated meals and also tried some new foods for camping trips (that could be its own post!) (4) I cut out sugar and am eating more natural items and I tried a lot of new products for this as well (this could also be its own post). However, an interesting note is that if you add groceries + dining out, I spent less in total this year than I do on average (almost 20% less).
Transportation: (Increase 14% YoY) This category is often my third biggest as it consists of daily public transportation commute costs plus any car related costs like gas, tolls or maintenance. This year, due to COVID, I actually did go into work every day, but I drove instead of taking public transportation, which upped my car related costs significantly. In addition, I had to buy two new tires and a new side window for the Red Rocket in 2020.
Travel: (Decrease 64% YoY) This includes any flights, meals, lodging or activities while traveling. This year I took one flight and paid for one that I did not use. Otherwise, I took a couple of road trips. I tried to be more diligent with breaking down my costs, so this does account for all camping, food, gas etc. that I used while doing the road trips, but there were a lot of cooler and backpack meals and wild camping, so the number was very low.
Misc.: (Decrease 36% YoY) This category is mainly gifts. There are a few credit card fees in there as well, but they are minimal. Normally this includes education, hair cuts and massages, but well...I paid for my education in 2019 and it's still postponed, and there have been no hair cuts this year and I decided to put my one massage in Health instead.
Entertainment: (Increase 10% YoY) This consists of any running, camping, music or national park related items or any other fun activities (excluding travel). This category was larger than normal because of my different allocations this year. In prior years, running shoes were under "shopping" but this year I decided to put them under entertainment. In addition, if I bought food that was only going to be used for camping (a bit of a grey area at times), I categorized it here. The big ticket items were a new tent, two concerts and three pairs of running shoes (I always buy them if they are on sale).
Health: (Increase 69% YoY) This consists of gym membership, health insurance, doctors visits and things like vitamins and protein powder. This year my insurance increased a little, and I also spent some money trying to figure out a pain I had in my foot at the beginning of the year. However, I did finally cancel the gym membership that I was paying for every money but not using!
Shopping: (Decrease 29% YoY) This category was mostly toiletries, home supplies and kitchen gadgets, with the bulk of the total going towards a new Ninja. Actually my second largest subcategory here was pet supplies. Gato had fleas a few years ago and I have happily spent money on flea treatment and prevention since then. Fleas give me nightmares.
Dining Out: (Decrease 90% YoY) Most of my dining out is covered in travel. In fact, I only dined out a few times in January and February when I had some friends visit and we went for beers etc. Otherwise, I bought burritos for my two office mates mid-COVID but that is it!
The Verdict?: I am now an expert at online shopping. I know where to find a good sugar-free jerky and that MRIs and pet supplies are expensive. Reading and weeding are both free. Owning a house is not. I wonder if next year's grocery number will be lower because I will still be working my way through all of the beef sticks and protein powders that I bought this year.
Did you spend more or less in 2020 than you normally do? Which categories do you think differed the most year over year?
1.04.2018
Looking Back: 2017 Money Pie
This pie is for spending only, and does not include savings. Here they are, in order of greatest to least!
Groceries/Dining Out: In 2017, I actually spent 17% less on food than I did in 2016. I had to double and triple check that number though, as I did not feel that it could be correct. However, after checking, I did confirm that I spent about the same amount dining out, but a lot less on groceries. The culprit? Costco! In 2016, I took 5 big Costco trips, whereas in 2017 I only took 3 and man, what a difference a Costco trip makes!!
Misc: This includes personal care, toiletries, gifts and donations, credit card fees and things like that. This year my dollar amount increased significantly! The bulk of it is gifts, but I had some registration/education fees to pay this year which really upped the dollar amount of this category a lot.
Health: This includes pre-tax deductions and any copay or charge for the gym, prescriptions, contact lenses etc. The bulk of this percentage is health insurance.
Shopping: This category pretty much includes anything I buy on Amazon, regardless of the use. I am too lazy to sort through the purchases to see what is food related or what is not. In fact, that could be a big reason why my food spending was so much "less" in 2017, as I do buy a lot of dry goods on Amazon. In addition, much of it could probably also go towards the Entertainment or the Travel categories as well, as I did buy some camping/hiking related items as well.
Entertainment: This includes movies, baseball games, and running related (or other hobbies) expenses. This year, most of it went to race fees. I did travel for running, but I kept that in the travel category.
The Verdict: In 2017, as planned, I did spend less dollars than last year. However, it's a bit of a cheat, as I bought a car last year. Without the car purchase, I would have spent about 9% more in 2017 than I did in 2016. I did see big increases in Health (I blame premiums), Misc (education) and Shopping (laziness of not sorting the category, aka human error). I spent a lot less on Groceries (sorting/human error/Costco) and Transportation (car purchase) and pretty much the exact same amount on Dining Out and Home.
What should I do differently? I would say that aside from spending less on shopping, I should probably get a better categorization system for Amazon purchases. Otherwise, I could travel less. NOT! Actually, most of my travel involved camping, so the bulk of the cost was flights and transportation costs.
Do you tally up your spending at the end of the year? Do you budget for next year? What was your highest spending category in 2017?
1.02.2017
Looking Back: 2016 Money Pie
Groceries/Dining Out: Once again, these are almost the same! This year some friends and I went out to a nice meal once a month and we took turns paying. This equates to about once every four months me spending way too much on dinner. However, it is a lot of fun, but it's not helping my "dining out" budget.
Misc: This includes personal care, toiletries, gifts and donations, credit card fees and things like that. The bulk of it is gifts. The other things are minor.
Health: This includes pre-tax deductions and any copay or charge for contact lenses etc.
Entertainment: This includes movies, baseball games, and running related (or other hobbies) expenses. This year, most of it went to race fees. I probably should shift some of my "travel" over to this category, but once again, I am too lazy to really sort it out that thoroughly.
Shopping: This category included clothing, toiletries and items from Target that were not home or running related. This year I bought a couple of pairs of work shoes and some things from REI which could be in the entertainment category...and that is pretty much it.
So, what did I learn from this? This year I definitely spent more that last year, although a lot of that extra cost was due to my purchase of a car. However, excluding the transportation category, the biggest increases over last year belonged to the Entertainment (53%), Health (33%) and Home (26%) categories. This makes sense, as I signed up for more big ticket races, my insurance premium went up, and I was in my house for a whole year vs. 7 months last year. On the flip side, I also saved more this year, so I am pretty happy with that, as my goal from the beginning of this year was to save more if I could.
What do I want to accomplish this year? This year I hope to do a bit of deeper analysis and develop a plan regarding getting the best bang for my buck. For example, does it make more financial sense to put my money into savings or use it to pay off my mortgage quicker. I have most of the information I need; now it is time to execute! In addition, once again I would like to save more this year than I saved last year. I would like to say I could minimize the Home category, but in reality, there is always a backyard project or a broken pipe or a random thing that goes bump in the night. So, that's it!
Do you keep track of your spending habits? What is the biggest piece of your money pie? What are your financial goals this year?
1.14.2016
Take the Money and Run
Groceries/Eating Out: Funny that these are almost the same! I probably only eat out about once a month, so this shows that when I do eat out, it is a major event! Eating out also includes coffee shops and beer, which is probably the majority of my expense in that category! I also put all Costco trips in the grocery category, even though there were some other odds and ends in the basket usually.
Misc: This includes haircuts, gifts and donations, credit card fees.. things like that. The bulk of it is gifts and donations. I think I got my hair cut twice last year!
Health: This includes pre-tax deductions and any copay or charge for contact lenses etc.
Entertainment: This includes movies, baseball games, and running related (or other hobbies) expenses. Truly this year I did not spend a lot on running gear, only race fees. Also, like I said before, my transportation to running events was either carpooling or it went into the transportation or travel category. It may be better to try to separate those out this year to get a more accurate idea of where the money is going.
Shopping: If it's not food, I don't buy it! This category included clothing, toiletries and items from Target that were not home or running related. I literally bought maybe 4 (Banana Republic) shirts for myself this year from a thrift store, and that was about it! k
So, what did I learn from this? I am pretty happy about where I spent my money in 2015. If needed, I could definitely spend less on travel. Currently it is not necessary, but it would have to be the first thing to get a haircut if I needed some extra money. As you can see, I don't really spend a lot on unnecessary things, except for travel. I am also happy about how much I am putting aside and am trying to increase my savings amounts if I get a raise this year, instead of just spending more.
What is the biggest piece of your spending pie? Do you keep track of where your money goes? What are your financial goals this year?